Question Title
How to adjust the layer order of the lines in a line chart in VChart?
Problem Description
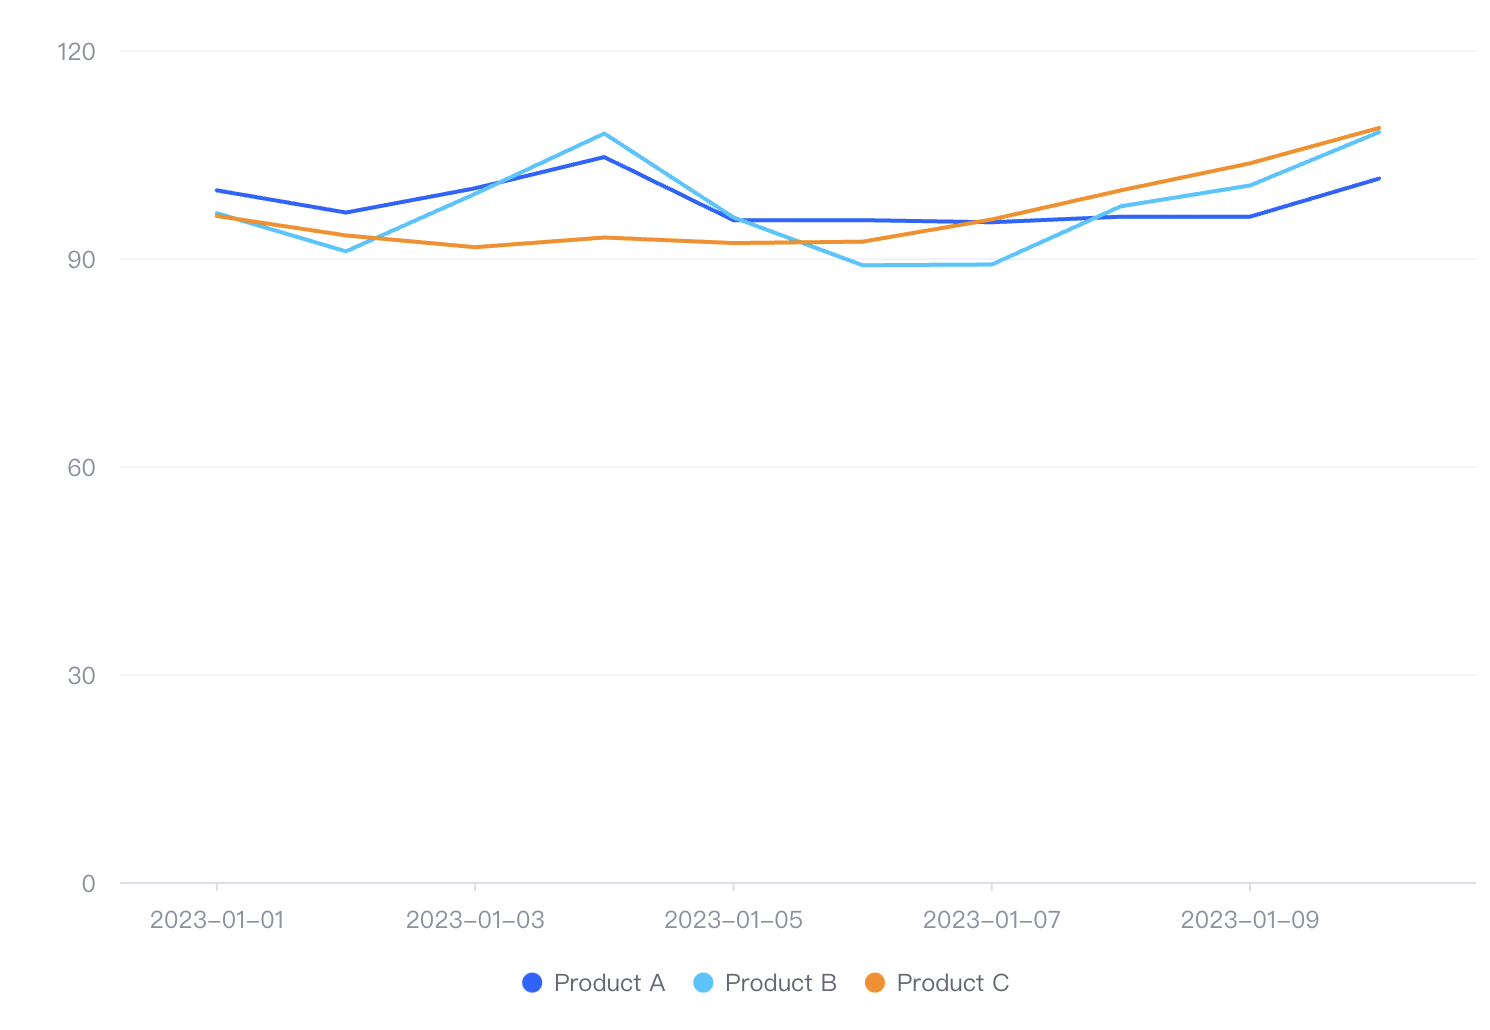
In the line chart as shown below, how can I make the blue line on the top layer?

Solution
When displaying the line chart, it is grouped according to the grouping fields in the data, and the last grouping with values in the grouping fields will have a higher level than the first grouping; the performance is that in the above figure, the last item in the legend item corresponds to the line with the highest level; so, to adjust the level of the line, there are two solutions:
- Sort the data according to the grouping fields
- Adjust the
zIndexvisual channel mapping of the line
line: {
    style: {
      lineWidth: 2,
      zIndex: (datum) => {
        switch(datum.type) {
          case 'Product A':
            return 3;
          case 'Product B':
            return 2;
          case 'Produce C':
            return 1;
        }
      }
    }
  },</br>
Code Examples
const spec = {
  type: 'line',
  data: {
    values: [
      { date: '2023-01-01', type: 'Product A', value: 99.9 },
      { date: '2023-01-01', type: 'Product B', value: 96.6 },
      { date: '2023-01-01', type: 'Product C', value: 96.2 },
      { date: '2023-01-02', type: 'Product A', value: 96.7 },
      { date: '2023-01-02', type: 'Product B', value: 91.1 },
      { date: '2023-01-02', type: 'Product C', value: 93.4 },
      { date: '2023-01-03', type: 'Product A', value: 100.2 },
      { date: '2023-01-03', type: 'Product B', value: 99.4 },
      { date: '2023-01-03', type: 'Product C', value: 91.7 },
      { date: '2023-01-04', type: 'Product A', value: 104.7 },
      { date: '2023-01-04', type: 'Product B', value: 108.1 },
      { date: '2023-01-04', type: 'Product C', value: 93.1 },
      { date: '2023-01-05', type: 'Product A', value: 95.6 },
      { date: '2023-01-05', type: 'Product B', value: 96 },
      { date: '2023-01-05', type: 'Product C', value: 92.3 },
      { date: '2023-01-06', type: 'Product A', value: 95.6 },
      { date: '2023-01-06', type: 'Product B', value: 89.1 },
      { date: '2023-01-06', type: 'Product C', value: 92.5 },
      { date: '2023-01-07', type: 'Product A', value: 95.3 },
      { date: '2023-01-07', type: 'Product B', value: 89.2 },
      { date: '2023-01-07', type: 'Product C', value: 95.7 },
      { date: '2023-01-08', type: 'Product A', value: 96.1 },
      { date: '2023-01-08', type: 'Product B', value: 97.6 },
      { date: '2023-01-08', type: 'Product C', value: 99.9 },
      { date: '2023-01-09', type: 'Product A', value: 96.1 },
      { date: '2023-01-09', type: 'Product B', value: 100.6 },
      { date: '2023-01-09', type: 'Product C', value: 103.8 },
      { date: '2023-01-10', type: 'Product A', value: 101.6 },
      { date: '2023-01-10', type: 'Product B', value: 108.3 },
      { date: '2023-01-10', type: 'Product C', value: 108.9 }
    ]
  },
  xField: 'date',
  yField: 'value',
  seriesField: 'type',
  point: {
    visible: false
  },
  line: {
    style: {
      lineWidth: 2,
      zIndex: (datum) => {
        switch(datum.type) {
          case 'Product A':
            return 3;
          case 'Product B':
            return 2;
          case 'Produce C':
            return 1;
        }
      }
    }
  },
  legends: { visible: true }
};</br>
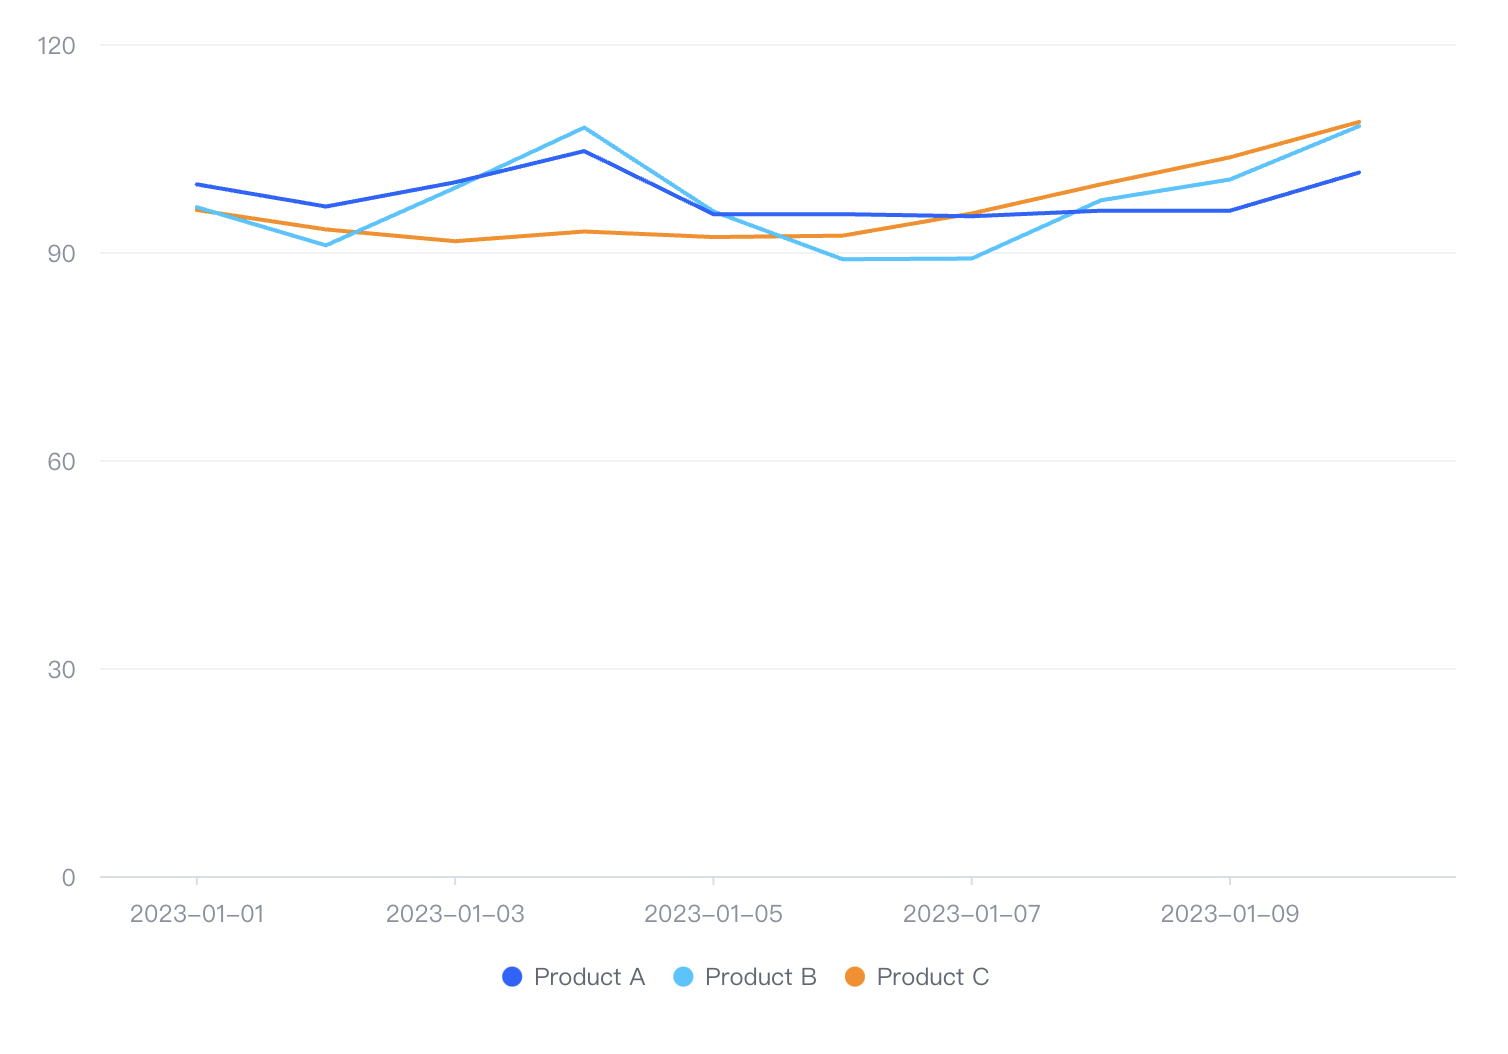
Results display

